• Menu
  • Home
  • About
  • Contact
    • Instant Home Value
    • Market Snapshot
    • Robert’s buyer presentation online
  • Fort Lauderdale
  • Property Pages
  • Featured Partners
  • Blog

Sunshine Guru

Robert Darrow, Broker Associate

  • Menu
  • Home
  • Home Value
  • Development
  • Areas
    • Aventura
    • Coconut Creek
    • Cooper City
    • Coral Springs
    • Dania Beach
    • Deerfield Beach
    • Fort Lauderdale
      • Fort Lauderdale – Coral Ridge
      • Fort Lauderdale – Coral Ridge Country Club
      • Fort Lauderdale – Coral Ridge Isles and Coral Heights
      • Fort Lauderdale – Harbor Beach
      • Fort Lauderdale – Harbordale
      • Fort Lauderdale – Middle River Terrace
      • Fort Lauderdale – North Andrews Gardens
      • Fort Lauderdale – Rio Vista
      • Fort Lauderdale – Tarpon River
      • Fort Lauderdale – Victoria Park
      • Fort Lauderdale – Las Olas Isles, Seven Isles, East Fort Lauderdale Isles
    • Hallandale Beach
    • Hollywood
    • Imperial Point
    • Lauderdale by the Sea
    • Lauderdale Lakes
    • Lauderhill
    • Lighthouse Point
    • North Lauderdale
    • Oakland Park
    • Palm Aire in Pompano Beach
    • Pembroke Pines
    • Plantation
    • Pompano Beach
    • Sunrise
    • Tamarac
    • Weston
    • Wilton Manors
  • Schools
  • 55+

3 Graphs Showing Why Today’s Housing Market Isn’t Like 2008

3 Graphs Showing Why Today’s Housing Market Isn’t Like 2008 | Simplifying The Market

With all the headlines and talk in the media about the shift in the housing market, you might be thinking this is a housing bubble. It’s only natural for those thoughts to creep in that make you think it could be a repeat of what took place in 2008. But the good news is, there’s concrete data to show why this is nothing like the last time.

There’s Still a Shortage of Homes on the Market Today, Not a Surplus

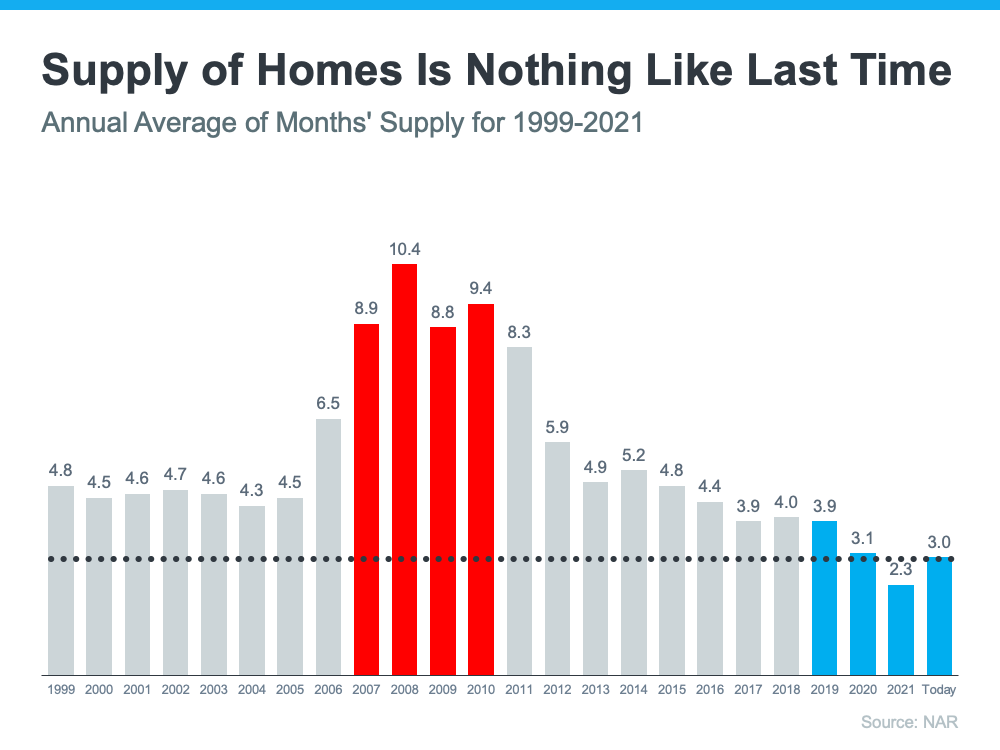
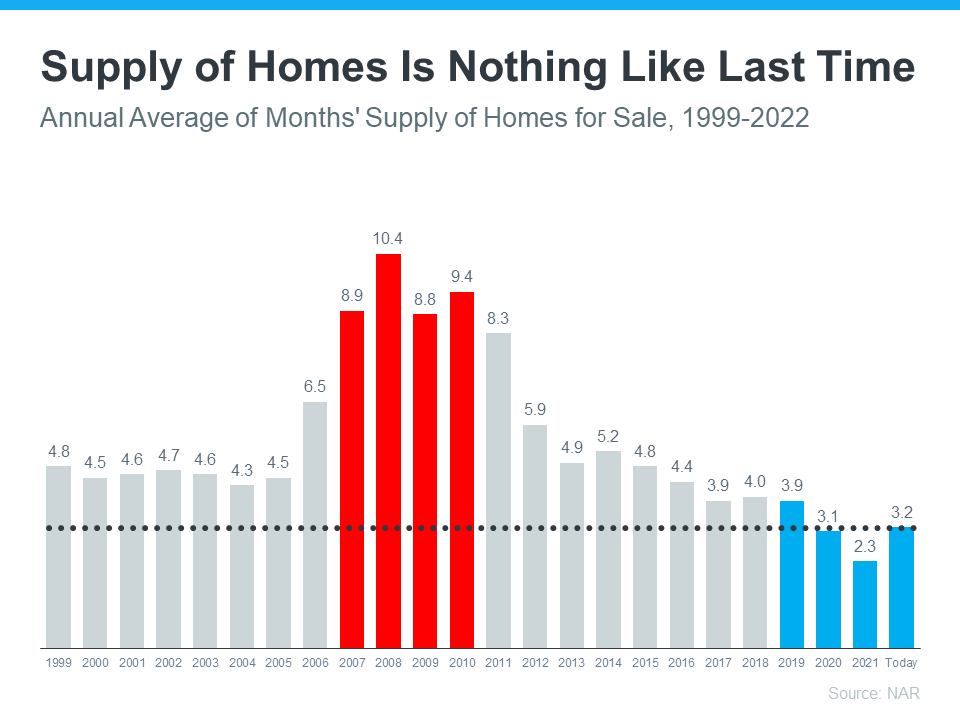
For historical context, there were too many homes for sale during the housing crisis (many of which were short sales and foreclosures), and that caused prices to fall dramatically. Supply has increased since the start of this year, but there’s still a shortage of inventory available overall, primarily due to almost 15 years of underbuilding homes.

The graph below uses data from the National Association of Realtors (NAR) to show how the months’ supply of homes available now compares to the crash. Today, unsold inventory sits at just a 3.2-months’ supply at the current sales pace, which is significantly lower than the last time. There just isn’t enough inventory on the market for home prices to come crashing down like they did last time, even though some overheated markets may experience slight declines.

3 Graphs Showing Why Today’s Housing Market Isn’t Like 2008 | Simplifying The Market

Mortgage Standards Were Much More Relaxed Back Then

During the lead-up to the housing crisis, it was much easier to get a home loan than it is today. Running up to 2006, banks were creating artificial demand by lowering lending standards and making it easy for just about anyone to qualify for a home loan or refinance their current home.

Back then, lending institutions took on much greater risk in both the person and the mortgage products offered. That led to mass defaults, foreclosures, and falling prices. Today, things are different, and purchasers face much higher standards from mortgage companies.

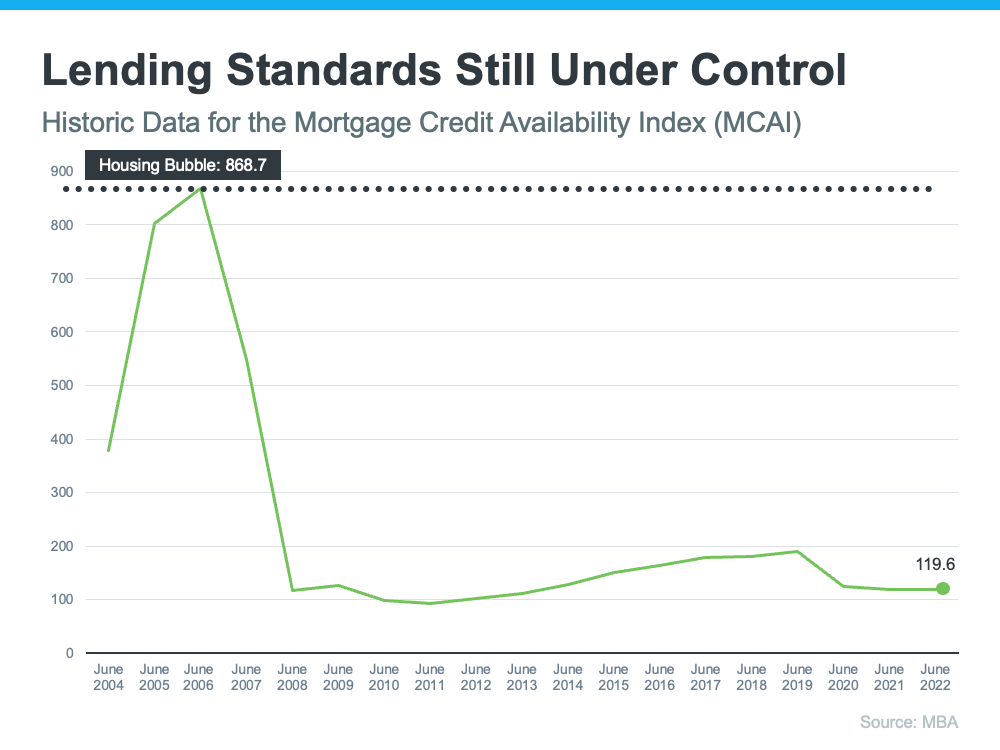
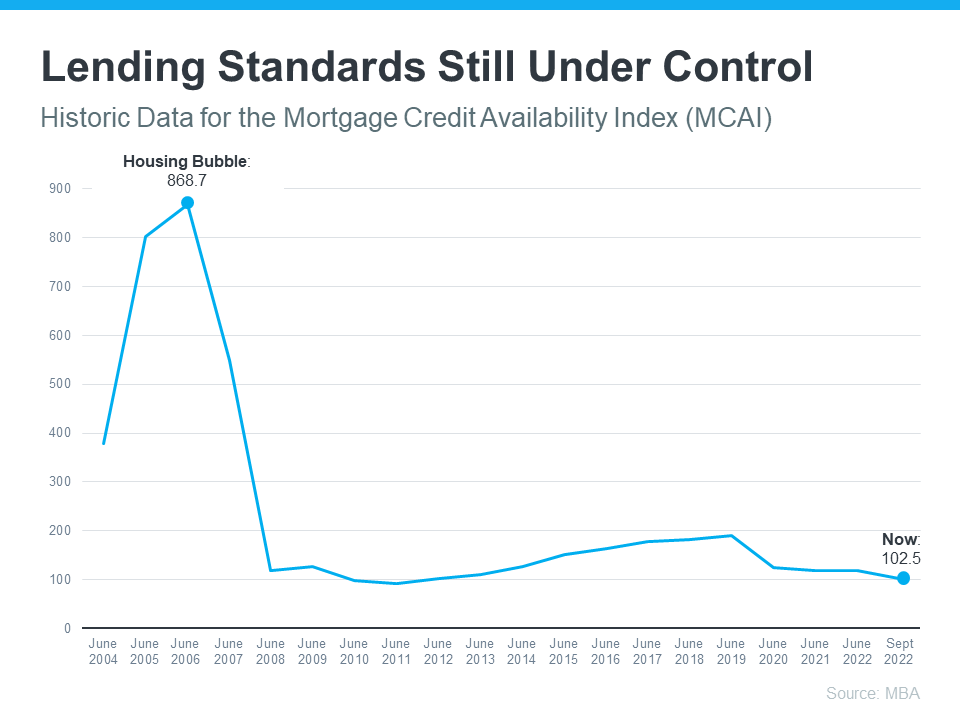
The graph below uses Mortgage Credit Availability Index (MCAI) data from the Mortgage Bankers Association (MBA) to help tell this story. In that index, the higher the number, the easier it is to get a mortgage. The lower the number, the harder it is. In the latest report, the index fell by 5.4%, indicating standards are tightening.

3 Graphs Showing Why Today’s Housing Market Isn’t Like 2008 | Simplifying The Market

This graph also shows just how different things are today compared to the spike in credit availability leading up to the crash. Tighter lending standards over the past 14 years have helped prevent a scenario that would lead to a wave of foreclosures like the last time.

The Foreclosure Volume Is Nothing Like It Was During the Crash

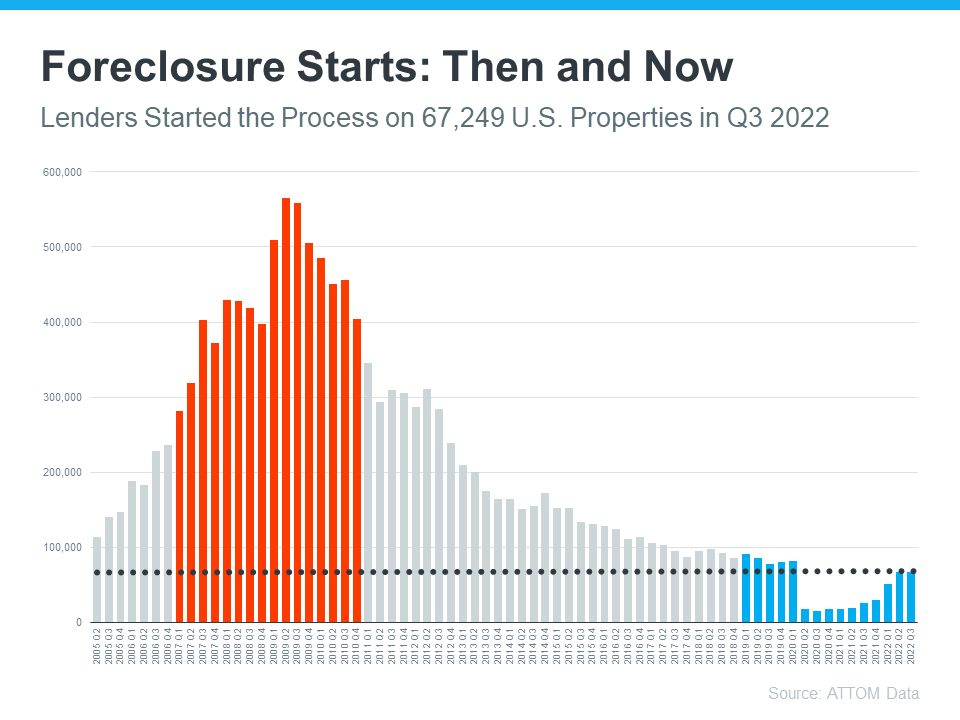
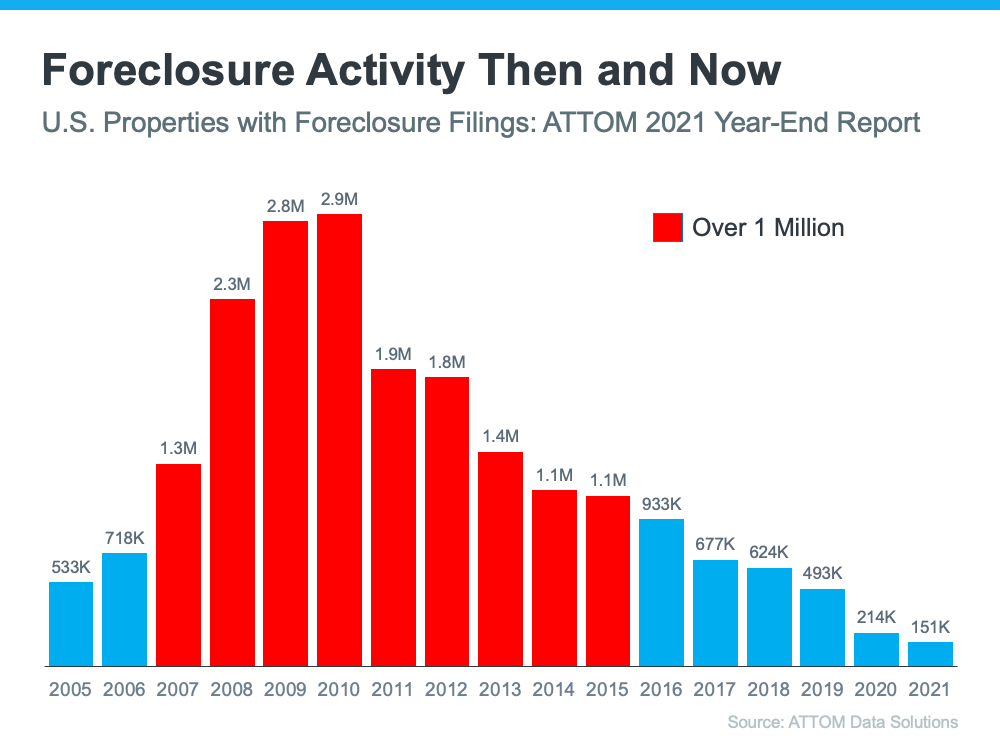
Another difference is the number of homeowners that were facing foreclosure after the housing bubble burst. Foreclosure activity has been lower since the crash, largely because buyers today are more qualified and less likely to default on their loans. The graph below uses data from ATTOM Data Solutions to help paint the picture of how different things are this time:

3 Graphs Showing Why Today’s Housing Market Isn’t Like 2008 | Simplifying The Market

Not to mention, homeowners today have options they just didn’t have in the housing crisis when so many people owed more on their mortgages than their homes were worth. Today, many homeowners are equity rich. That equity comes, in large part, from the way home prices have appreciated over time. According to CoreLogic:

“The total average equity per borrower has now reached almost $300,000, the highest in the data series.”

Rick Sharga, Executive VP of Market Intelligence at ATTOM Data, explains the impact this has:

“Very few of the properties entering the foreclosure process have reverted to the lender at the end of the foreclosure. . . . We believe that this may be an indication that borrowers are leveraging their equity and selling their homes rather than risking the loss of their equity in a foreclosure auction.”

 This goes to show homeowners are in a completely different position this time. For those facing challenges today, many have the option to use their equity to sell their house and avoid the foreclosure process.

Bottom Line

If you’re concerned we’re making the same mistakes that led to the housing crash, the graphs above should help alleviate your fears. Concrete data and expert insights clearly show why this is nothing like the last time.
Posted in: Advice, For Buyers, For Sellers, Foreclosures, Housing Market Updates, Marketwatch, Pricing

Why the Forbearance Program Changed the Housing Market

Why the Forbearance Program Changed the Housing Market | Simplifying The Market

When the pandemic hit in 2020, many experts thought the housing market would crash. They feared job loss and economic uncertainty would lead to a wave of foreclosures similar to when the housing bubble burst over a decade ago. Thankfully, the forbearance program changed that. It provided much-needed relief for homeowners so a foreclosure crisis wouldn’t happen again. Here’s why forbearance worked.

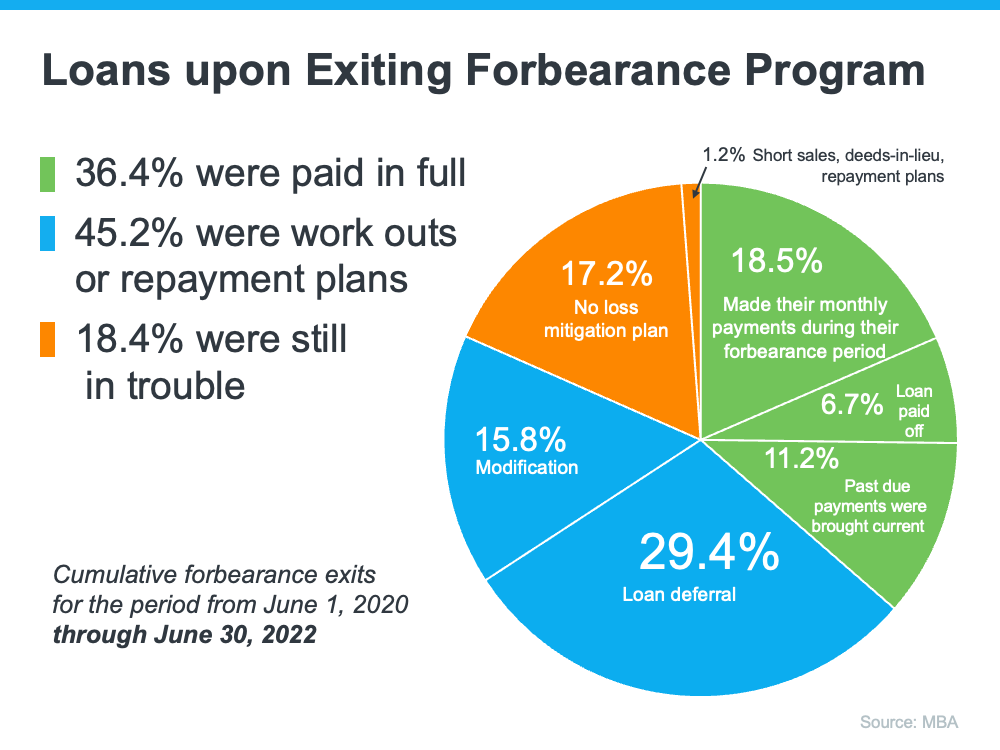
Forbearance enabled nearly five million homeowners to get back on their feet in a time when having the security and protection of a home was more important than ever. Those in need were able to work with their banks and lenders to stay in their homes rather than go into foreclosure. Marina Walsh, Vice President of Industry Analysis at the Mortgage Bankers Association (MBA), notes:

“Most borrowers exiting forbearance are moving into either a loan modification, payment deferral, or a combination of the two workout options.”

As the graph below shows, with modification, deferral, and workout options in place, four out of every five homeowners in forbearance are either paid in full or are exiting with a plan. They’re able to stay in their homes.

Why the Forbearance Program Changed the Housing Market | Simplifying The Market

What does this mean for the housing market?

Since so many people can stay in their homes and work out alternative options, there won’t be a wave of foreclosures coming to the market. And while rising slightly since the foreclosure moratorium was lifted this year, foreclosures today are still nowhere near the levels seen in the housing crisis.

Forbearance wasn’t the only game changer, either. Lending standards have improved significantly since the housing bubble burst, and that’s one more thing keeping foreclosure filings low. Today’s borrowers are much more qualified to pay their home loans.

And while the majority of homeowners are exiting the forbearance program with a plan, for those who still need to make a change due to financial hardship or other challenges, today’s record-level of equity is giving them the opportunity to sell their houses and avoid foreclosure altogether. Homeowners have options they just didn’t have in the housing crisis when so many people owed more on their mortgages than their homes were worth. Thanks to their equity and the current undersupply of homes on the market, homeowners can sell their houses, make a move, and not have to go through the foreclosure process that led to the housing market crash in 2008.

Thomas LaSalvia, Chief Economist with Moody’s Analytics, states:

“There’s some excess savings out there, over 2 trillion worth. . . . There are people that have ownership of those homes right now, that even in a downturn, they’d still likely be able to pay that mortgage and won’t have to hand over keys. And there won’t be a lot of those distressed sales that happened in the 2008 crisis.”

Bottom Line

The forbearance program was a game changer for homeowners in need. It’s one of the big reasons why we won’t see a wave of foreclosures coming to the market.

Posted in: Advice, Distressed Properties, Foreclosures, Housing Market Updates, Marketwatch

3 Graphs To Show This Isn’t a Housing Bubble

3 Graphs To Show This Isn’t a Housing Bubble | Simplifying The Market

With all the headlines and buzz in the media, some consumers believe the market is in a housing bubble. As the housing market shifts, you may be wondering what’ll happen next. It’s only natural for concerns to creep in that it could be a repeat of what took place in 2008. The good news is, there’s concrete data to show why this is nothing like the last time.
There’s a Shortage of Homes on the Market Today, Not a Surplus

The supply of inventory needed to sustain a normal real estate market is approximately six months. Anything more than that is an overabundance and will causes prices to depreciate. Anything less than that is a shortage and will lead to continued price appreciation.

For historical context, there were too many homes for sale during the housing crisis (many of which were short sales and foreclosures), and that caused prices to tumble. Today, supply is growing, but there’s still a shortage of inventory available.

The graph below uses data from the National Association of Realtors (NAR) to show how this time compares to the crash. Today, unsold inventory sits at just a 3.0-months’ supply at the current sales pace.

3 Graphs To Show This Isn’t a Housing Bubble | Simplifying The Market

One of the reasons inventory is still low is because of sustained underbuilding. When you couple that with ongoing buyer demand as millennials age into their peak homebuying years, it continues to put upward pressure on home prices. That limited supply compared to buyer demand is why experts forecast home prices won’t fall this time.

Mortgage Standards Were Much More Relaxed During the Crash

During the lead-up to the housing crisis, it was much easier to get a home loan than it is today. The graph below showcases data on the Mortgage Credit Availability Index (MCAI) from the Mortgage Bankers Association (MBA). The higher the number, the easier it is to get a mortgage.

3 Graphs To Show This Isn’t a Housing Bubble | Simplifying The Market

Running up to 2006, banks were creating artificial demand by lowering lending standards and making it easy for just about anyone to qualify for a home loan or refinance their current home. Back then, lending institutions took on much greater risk in both the person and the mortgage products offered. That led to mass defaults, foreclosures, and falling prices.

Today, things are different, and purchasers face much higher standards from mortgage companies. Mark Fleming, Chief Economist at First American, says:

“Credit standards tightened in recent months due to increasing economic uncertainty and monetary policy tightening.” 

Stricter standards, like there are today, help prevent a risk of a rash of foreclosures like there was last time.

The Foreclosure Volume Is Nothing Like It Was During the Crash

The most obvious difference is the number of homeowners that were facing foreclosure after the housing bubble burst. Foreclosure activity has been on the way down since the crash because buyers today are more qualified and less likely to default on their loans. The graph below uses data from ATTOM Data Solutions to help tell the story:

3 Graphs To Show This Isn’t a Housing Bubble | Simplifying The Market

In addition, homeowners today are equity rich, not tapped out. In the run-up to the housing bubble, some homeowners were using their homes as personal ATMs. Many immediately withdrew their equity once it built up. When home values began to fall, some homeowners found themselves in a negative equity situation where the amount they owed on their mortgage was greater than the value of their home. Some of those households decided to walk away from their homes, and that led to a wave of distressed property listings (foreclosures and short sales), which sold at considerable discounts that lowered the value of other homes in the area.

Today, prices have risen nicely over the last few years, and that’s given homeowners an equity boost. According to Black Knight:

“In total, mortgage holders gained $2.8 trillion in tappable equity over the past 12 months – a 34% increase that equates to more than $207,000 in equity available per borrower. . . .”

With the average home equity now standing at $207,000, homeowners are in a completely different position this time.

Bottom Line

If you’re worried we’re making the same mistakes that led to the housing crash, the graphs above should help alleviate your concerns. Concrete data and expert insights clearly show why this is nothing like the last time.
Posted in: Advice, For Buyers, For Sellers, Foreclosures, Housing Market Updates, Marketwatch

What You Actually Need To Know About the Number of Foreclosures in Today’s Housing Market

What You Actually Need To Know About the Number of Foreclosures in Today’s Housing Market | Simplifying The Market

While you may have seen recent stories about the volume of foreclosures today, context is important. During the pandemic, many homeowners were able to pause their mortgage payments using the forbearance program. The goal was to help homeowners financially during the uncertainty created by the health crisis.

When the forbearance program began, many experts were concerned it would result in a wave of foreclosures coming to the market, as there was after the housing crash in 2008. Here’s a look at why the number of foreclosures we’re seeing today is nothing like the last time.
1. There Are Fewer Homeowners in Trouble

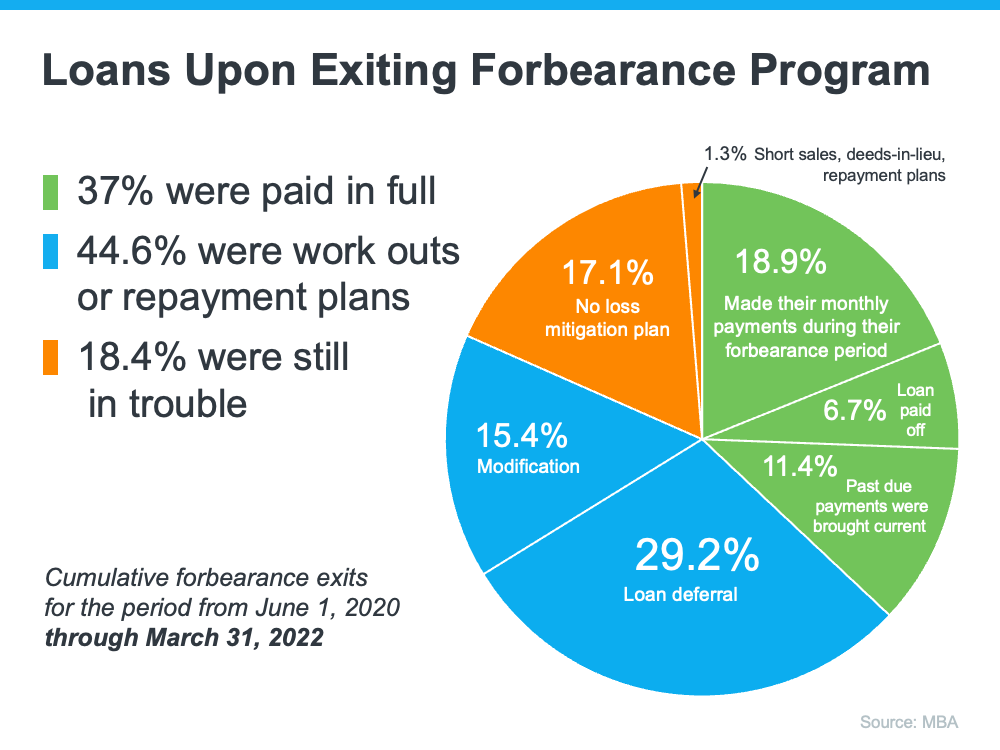
Today’s data shows that most homeowners are exiting their forbearance plan either fully caught up on payments or with a plan from the bank that restructured their loan in a way that allowed them to start making payments again. The graph below depicts those findings from the Mortgage Bankers Association (MBA):

What You Actually Need To Know About the Number of Foreclosures in Today’s Housing Market | Simplifying The Market

The same MBA report mentioned above estimates there are approximately 525,000 homeowners who remain in forbearance today. Thankfully, those people still have the chance to work out a suitable repayment plan with the servicing company that represents their lender.

2. Most Homeowners Have Enough Equity To Sell Their Homes

For those who are exiting the forbearance program without a plan in place, many will have enough equity to sell their homes instead of facing foreclosures. Due to rapidly rising home prices over the last two years, the average homeowner has gained record amounts of equity in their home.

Marina Walsh, CMB, Vice President of Industry Analysis at MBA, says:

“Given the nation’s limited housing inventory and the variety of home retention and foreclosure alternatives on the table across various loan
types, . . . Borrowers have more choices today to either stay in their homes or sell without resorting to a foreclosure.”

3. There Have Been Fewer Foreclosures over the Last Two Years

One of the seldom-reported benefits of the forbearance program was it gave homeowners facing difficulties an extra two years to get their finances in order and work out a plan with their lender. That helped prevent the foreclosures that normally would have come to the market had the new forbearance program not been available.

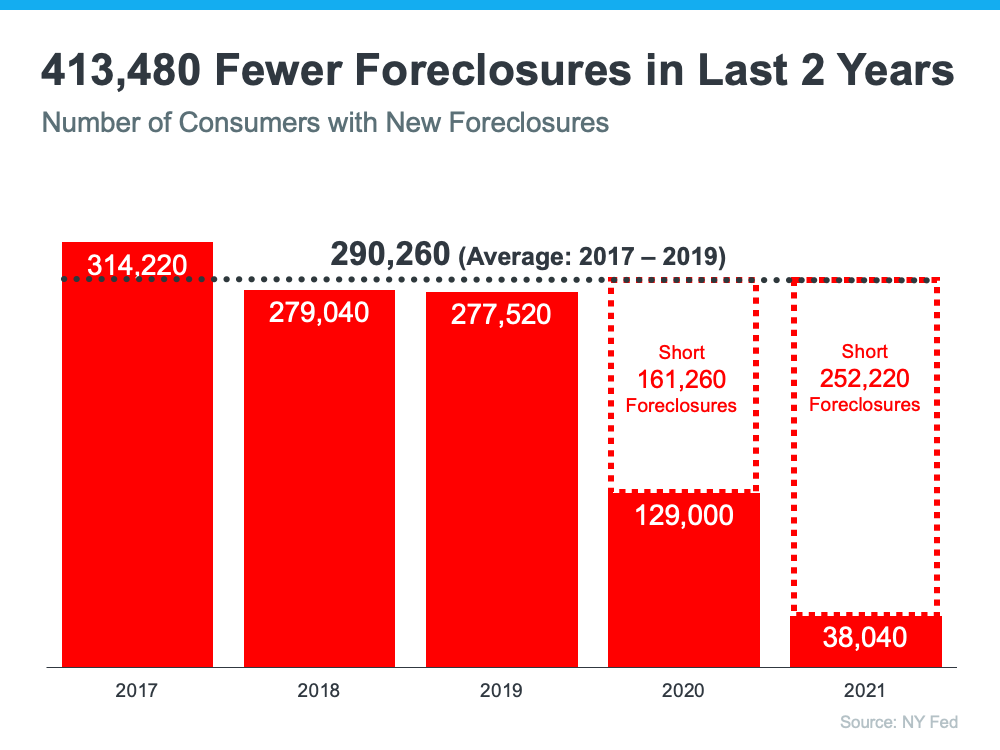
Even as people leave the forbearance program, there are still fewer foreclosures happening today than before the pandemic. That means, while there are more foreclosures now compared to last year (when foreclosures were paused), the number is still well below what the housing market has seen in a more typical year, like 2017-2019 (see graph below):

What You Actually Need To Know About the Number of Foreclosures in Today’s Housing Market | Simplifying The Market

4. The Current Market Can Easily Absorb New Listings

When the foreclosures in 2008 hit the market, they added to the oversupply of houses that were already for sale. It’s exactly the opposite today. The latest Existing Home Sales Report from the National Association of Realtors (NAR) reveals:

“Total housing inventory at the end of March totaled 950,000 units, up 11.8% from February and down 9.5% from one year ago (1.05 million). Unsold inventory sits at a 2.0-month supply at the present sales pace, up from 1.7 months in February and down from 2.1 months in March 2021.”

A balanced market would have approximately a six-month supply of inventory. At 2.0 months, today’s housing market is severely understocked. Even if one million homes enter the market, there still won’t be enough inventory to meet the current demand.

Bottom Line

If you see headlines about the increasing number of foreclosures today, remember context is important. While it’s true the number of foreclosures is higher now than it was last year, foreclosures are still well below pre-pandemic years.

If you have questions, let’s connect to talk through the latest market conditions and what they mean for you.

Posted in: Advice, Distressed Properties, Foreclosures, Housing Market Updates, Marketwatch

Posts navigation

  • « Previous Page
  • 1
  • 2

Robert Darrow

Robert Darrow your Sunshine Guru

Keller Williams Realty
3696 N. Federal Highway
Ft. Lauderdale, FL, 33308
(954) 446-9001

Contact the team

Go back

Your message has been sent

Warning
Warning
Warning
Warning

Warning.

View Robert Darrow's profile on LinkedIn

Real Estate Resources

  • Broward County Property Appraiser
  • Broward County Recorder's Office
  • Miami Dade Property Appraiser
  • Miami Dade Recorder of Deeds

Single Family Homes in:

  • Fort Lauderdale $1-million & up
  • Fort Lauderdale $100,000-$250,000
  • Fort Lauderdale $250,000 to $600,000
  • Fort Lauderdale $600,000 to $1-million
  • Oakland Park
  • Victoria Park over $1-million
  • Victoria Park up to $1-million
  • Weston $1.2-million & up
  • Weston $300,000-$700,000
  • Weston $700,000-$1.2-million
  • Wilton Manors

Townhomes & Condo's in:

  • Fort Lauderdale $1-million & up
  • Fort Lauderdale $100,000-$250,000
  • Fort Lauderdale $250,000-$600,000
  • Fort Lauderdale $600,000-$1-million
  • Oakland Park
  • Victoria Park over $1-million
  • Victoria Park up to $1-million
  • Weston
  • Wilton Manors
Client Reviews
2931372
"Bob was truly a pleasure to work with. We didn't have good luck with our previous realtor and with this being our first home we were buying we were ... more "
5.0/5.0
by bruiserboi7
2774807
"Robert did an excellent job listing and selling my condo. He was efficient, friendly, and professional at all times. This is one of the few times ... more "
5.0/5.0
by jjmagdic
2708728
"Robert is the absolute perfect realtor. He visited the condo, took photos, then, consulting us, arrived at a price. He aggressively marketed online ... more "
5.0/5.0
by brod307
© 2025 · Equity Framework
Log in
Manage Cookie Consent
To provide the best experiences, we use technologies like cookies to store and/or access device information. Consenting to these technologies will allow us to process data such as browsing behavior or unique IDs on this site. Not consenting or withdrawing consent, may adversely affect certain features and functions.
Functional Always active
The technical storage or access is strictly necessary for the legitimate purpose of enabling the use of a specific service explicitly requested by the subscriber or user, or for the sole purpose of carrying out the transmission of a communication over an electronic communications network.
Preferences
The technical storage or access is necessary for the legitimate purpose of storing preferences that are not requested by the subscriber or user.
Statistics
The technical storage or access that is used exclusively for statistical purposes. The technical storage or access that is used exclusively for anonymous statistical purposes. Without a subpoena, voluntary compliance on the part of your Internet Service Provider, or additional records from a third party, information stored or retrieved for this purpose alone cannot usually be used to identify you.
Marketing
The technical storage or access is required to create user profiles to send advertising, or to track the user on a website or across several websites for similar marketing purposes.
Manage options Manage services Manage {vendor_count} vendors Read more about these purposes
View preferences
{title} {title} {title}
 

Loading Comments...